



0-100:
Good-moderate
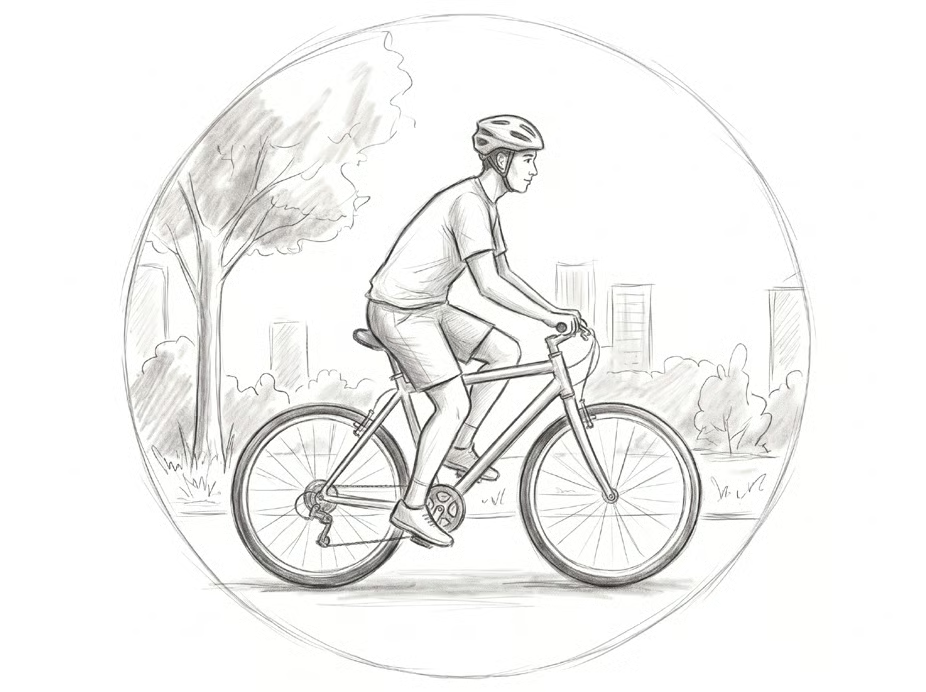
Continue normal outdoor activities.
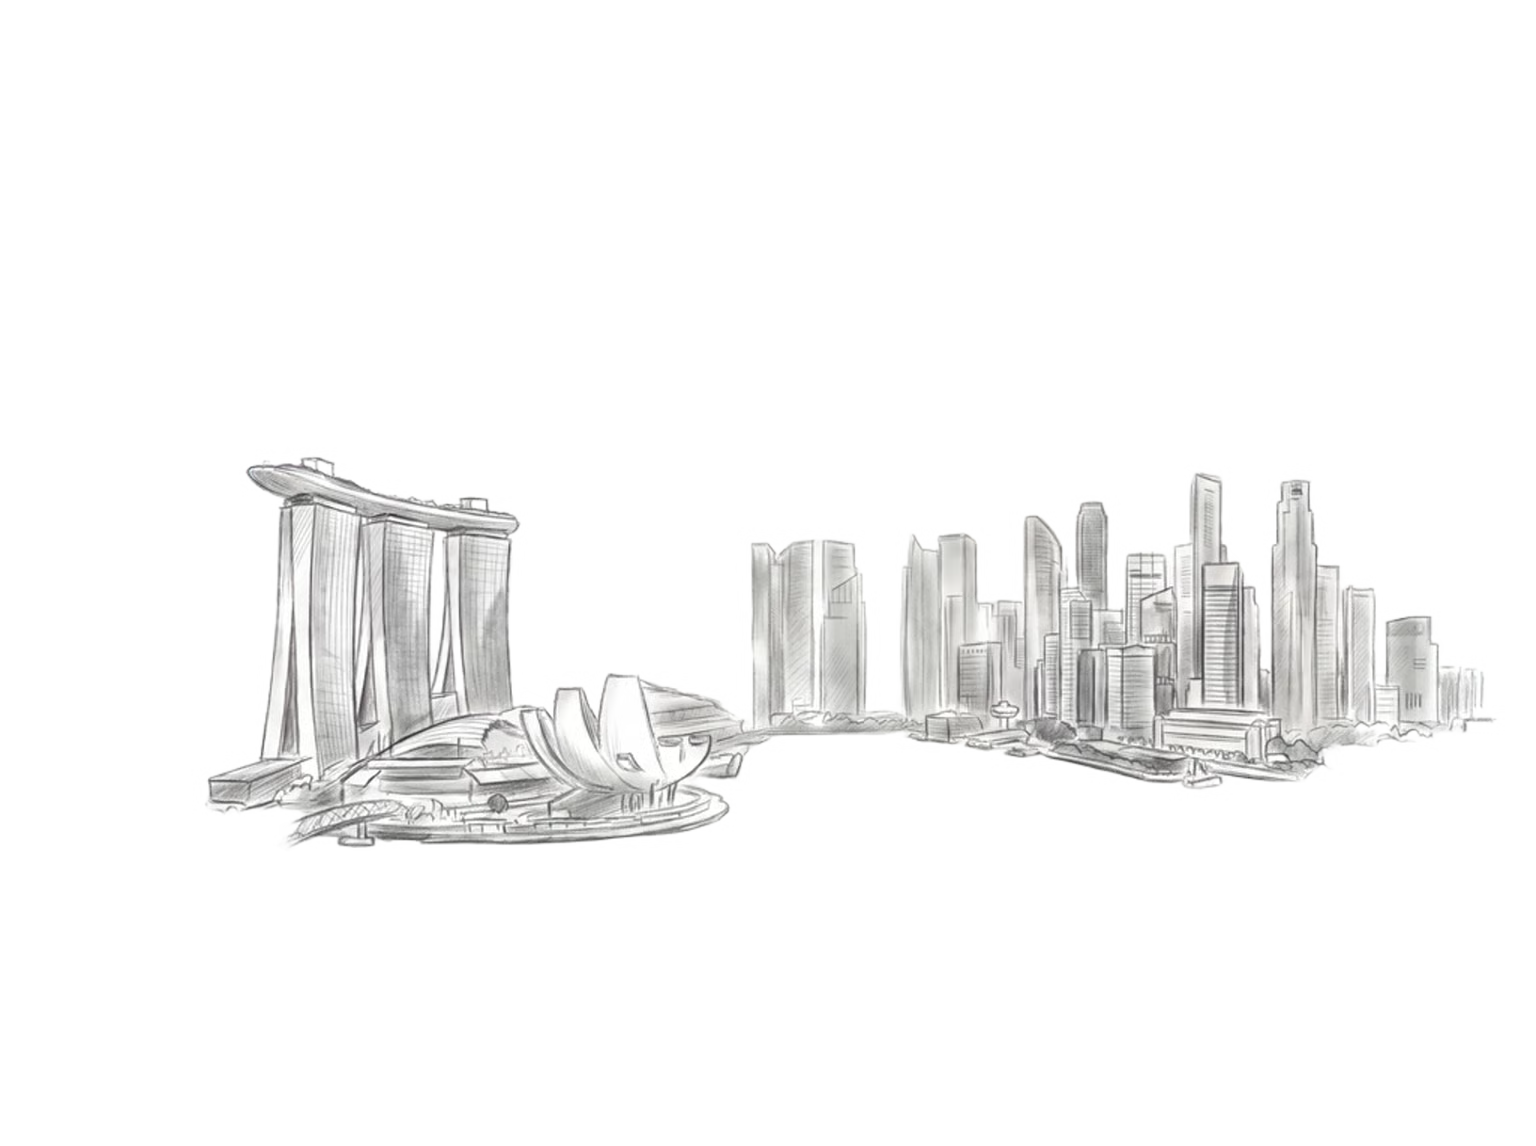
Tracking Singapore’s daily PSI readings through a very grey October.
OCTOBER was a tough month for our lungs, with transboundary haze keeping air quality bouncing between “moderate” and “very unhealthy”.
At its peak, the haze in Singapore forced major outdoor events such as the Singapore FA Cup final to be postponed. In total, this episode of haze is estimated to have cost the Republic's economy up to S$3.9 billion.
Here is how the daily numbers stacked up.
The Pollutant Standards Index (PSI) measures air quality based on six key pollutants, including carbon monoxide and micro-pollutants, known as PM2.5.
The 24-hour PSI shows the concentrations of these pollutants as a rolling average, and therefore gives a broader reflection of air quality over the course of the day.
One-hour PM2.5 readings, meanwhile, give a more immediate picture of current air quality and can therefore be more reliably used to determine the health effects of outdoor activities at any given time. These readings show the level of micro-pollutants with a diameter of 2.5 micrometres, about 30 times smaller than the width of a strand of hair, in the air.
Good-moderate
Continue normal outdoor activities.
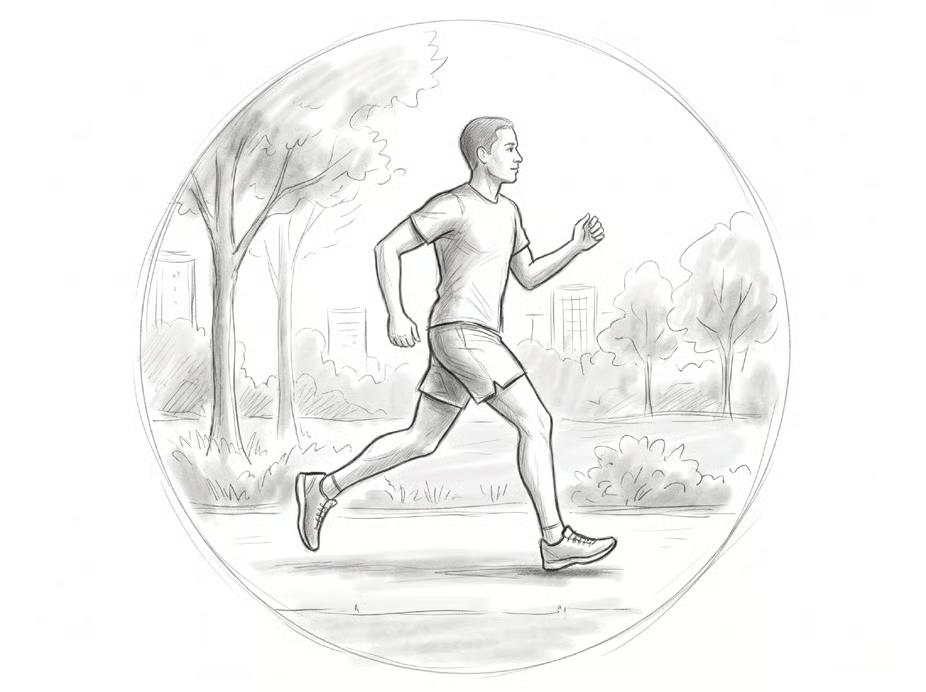
Unhealthy
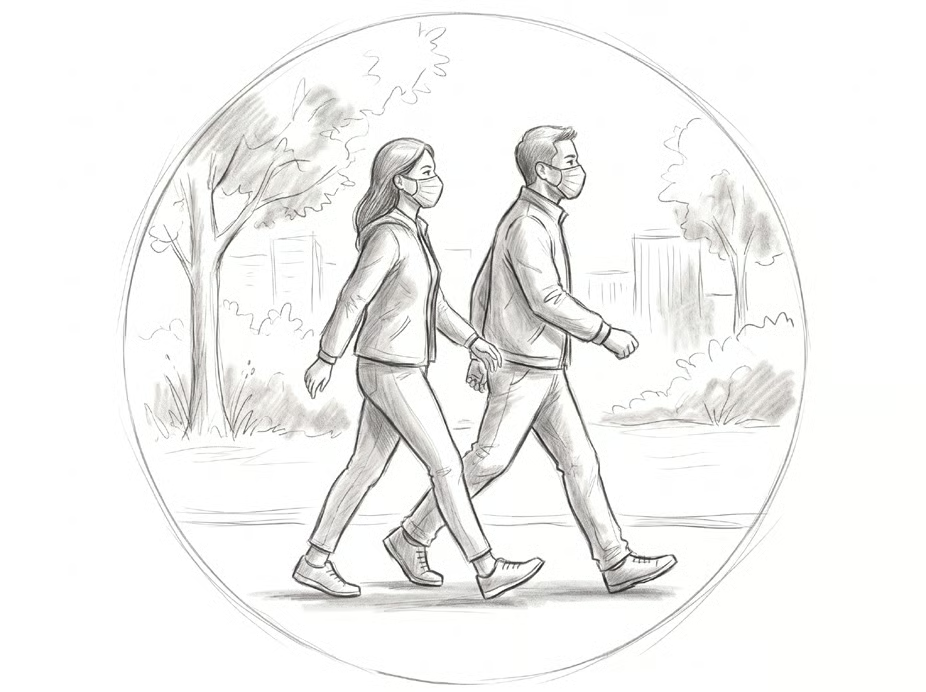
Reduce prolonged or strenuous outdoor activity.
Very unhealthy
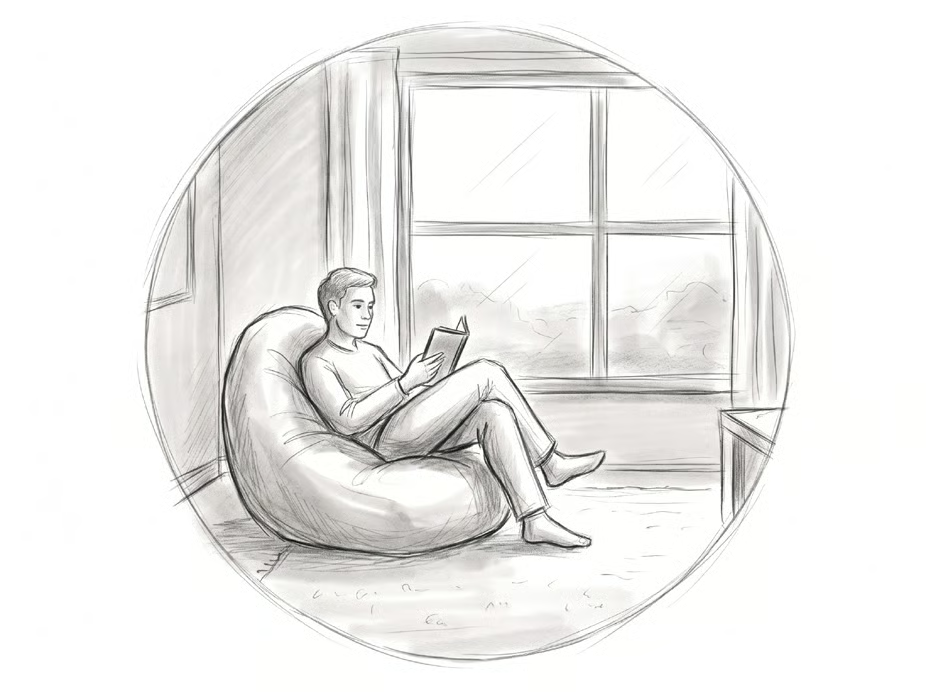
Avoid prolonged or strenuous outdoor activity.
Hazardous
Minimise all outdoor activity for the next hour.
Zone
North
South
East
West
Central

Midnight at top, noon at bottom.
Think of this chart like a 24-hour clock. The tick marks around the rim follow the hours of the day, moving clockwise from midnight at the top down to noon at the bottom.
Rings beyond 100 breach the Unhealthy threshold.
The grey rings measure pollution: The further a line pushes away from the centre, the higher the PSI.
0-100: Good-moderate
101-200: Unhealthy
201-300: Very unhealthy
>301: Hazardous
The West zone hit 230 PSI at 10:00, and again at 11:00.
Each coloured line tracks a different region in Singapore, showing exactly when and where the air reached “unhealthy” levels.
Hover or tap a zone in the legend to isolate its line. Hover or tap any hour on the dial to see every zone’s reading.
Scroll through to see how Singapore’s air quality changed across the 31 days of October. While much of the month stayed within “moderate” levels, the haze reached its peak on Oct 18, pushing deep into the “unhealthy” zone.
Zone
North
South
East
West
Central
October 1, 2026


























Oct 1
Peak: Oct 18
Oct 31